self-hosted personal finance
Know how much of your life your money already covers.
money tracks one number — the share of your monthly expenses paid by passive income, and whether it's trending up. Your ledger, investments, net worth, spending, and taxes, all pointed at that.
your data in a folder you own · export anytime
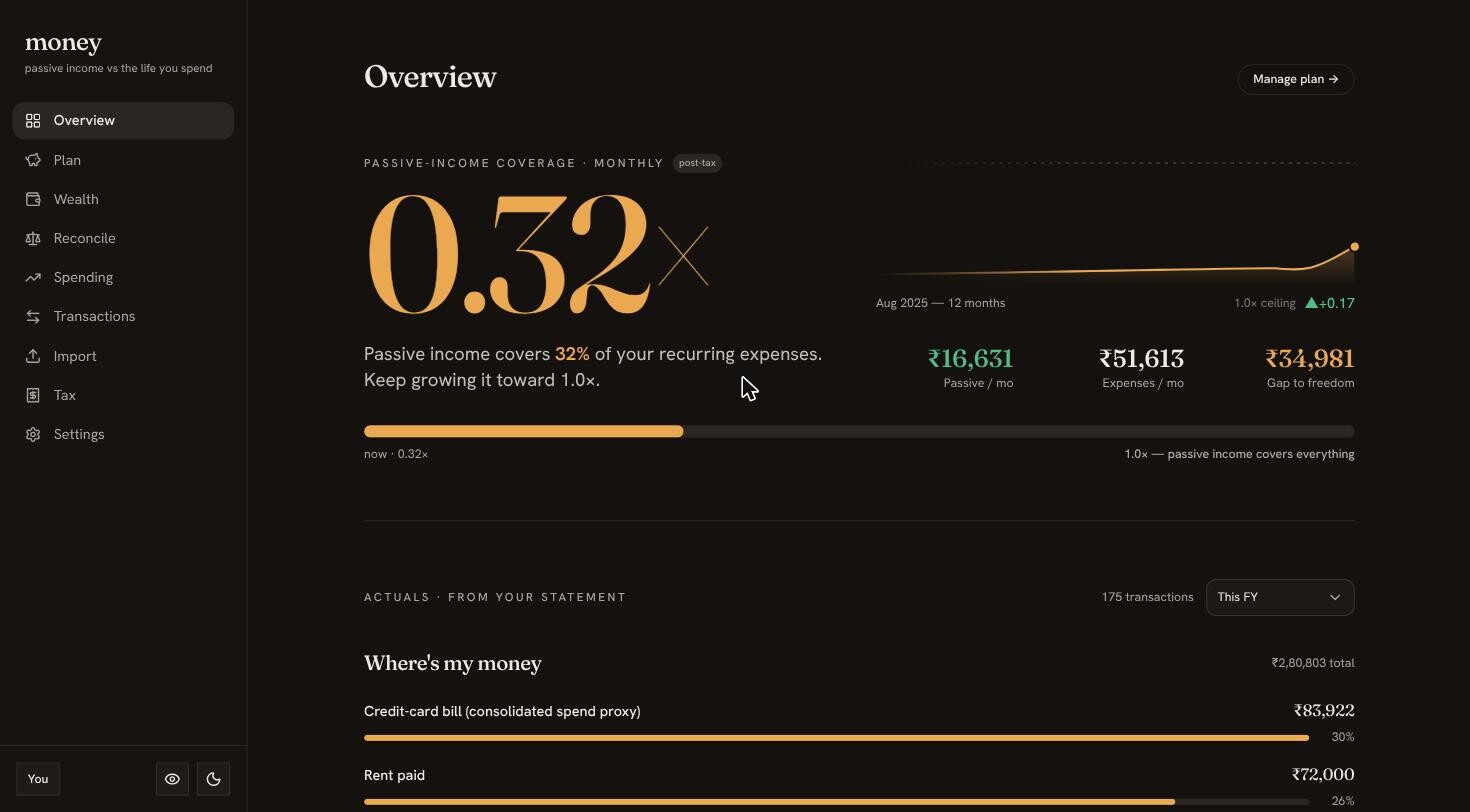
One honest ratio: how much of your life is already paid for.
Coverage is passive income divided by monthly expenses. A curated plan of what you own and what you spend rolls up into a single number — with a switchable after-tax view — and charts whether it's climbing.
- Passive income ÷ expenses, before and after tax
- A return ladder from cash to long-term holdings
- The trend line that says whether you're winning
Watch your net worth compound — not just sit in a spreadsheet.
Log holdings across a three-tier return ladder and track net worth over time with growth % and CAGR. A balance is a snapshot; a slope is a direction — this shows the slope.
- Net-worth log with growth % and CAGR
- Runway, freedom-date, and allocation views
- Every entry timestamped, nothing overwritten
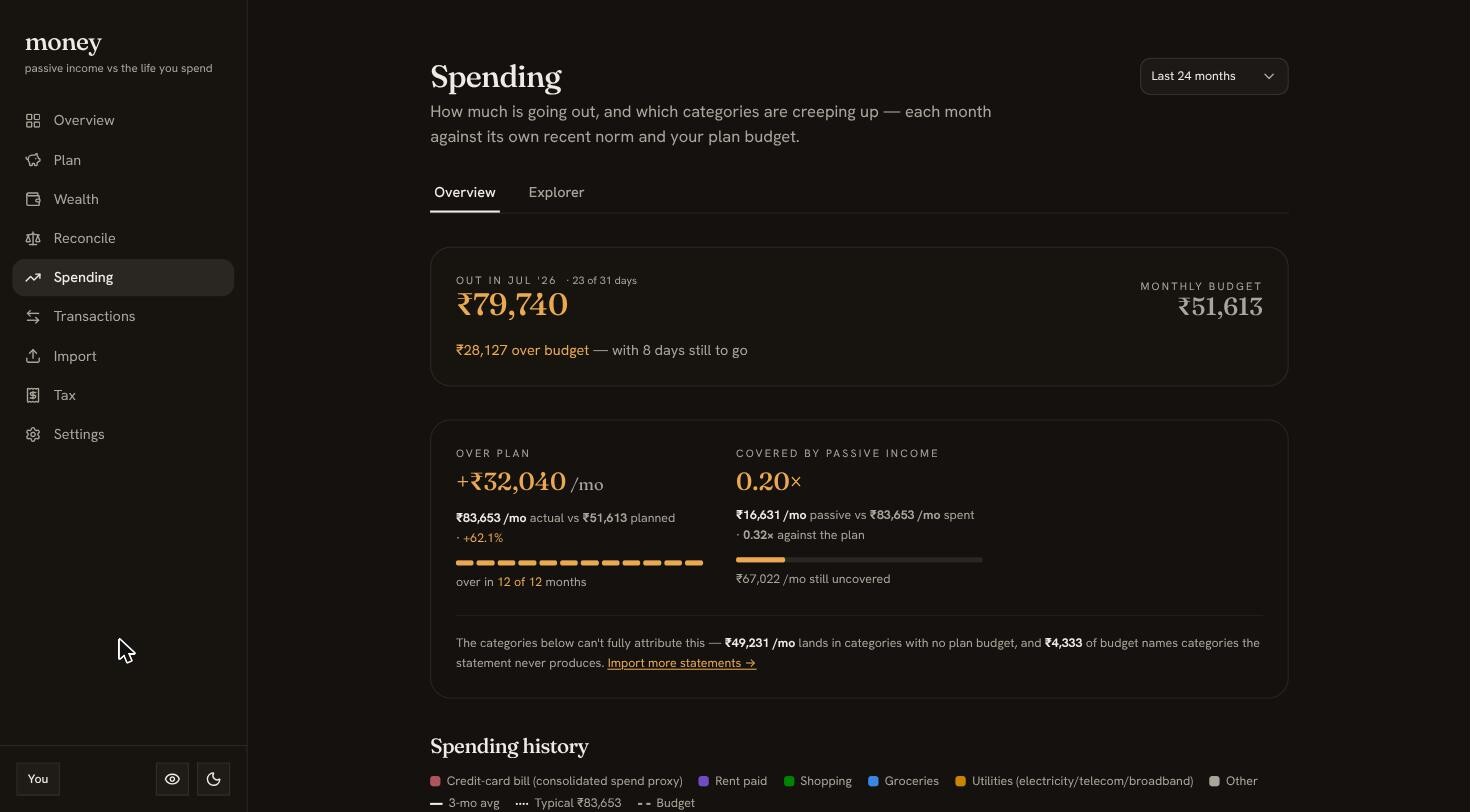
Measure spending against your plan, not against zero.
Every category, every month, laid over your plan budget — so you see what's over, and how much of the overage your passive income already covers. A budget you never revisit is just a wish.
- Category spend vs. plan budget, monthly
- See what passive income already absorbs
- The gap you'd need to close, in rupees
Catch the category that's quietly creeping up.
A stacked history of where the money actually goes, with the biggest movers surfaced and sparklined. Lifestyle creep hides in a single month's noise; over a year it's obvious.
- Stacked category history, month over month
- Biggest movers, each with a sparkline
- Click a month to jump to its transactions
Onboard any bank. Categorise once.
A generic field-mapping importer reads any bank's CSV — you map the columns once. Rules you write categorise transactions automatically; manual edits and splits stick. Export the whole ledger back out anytime.
- Field-mapping CSV import for any statement
- Editable rules do the categorising for you
- Split, override, and export to CSV — no lock-in
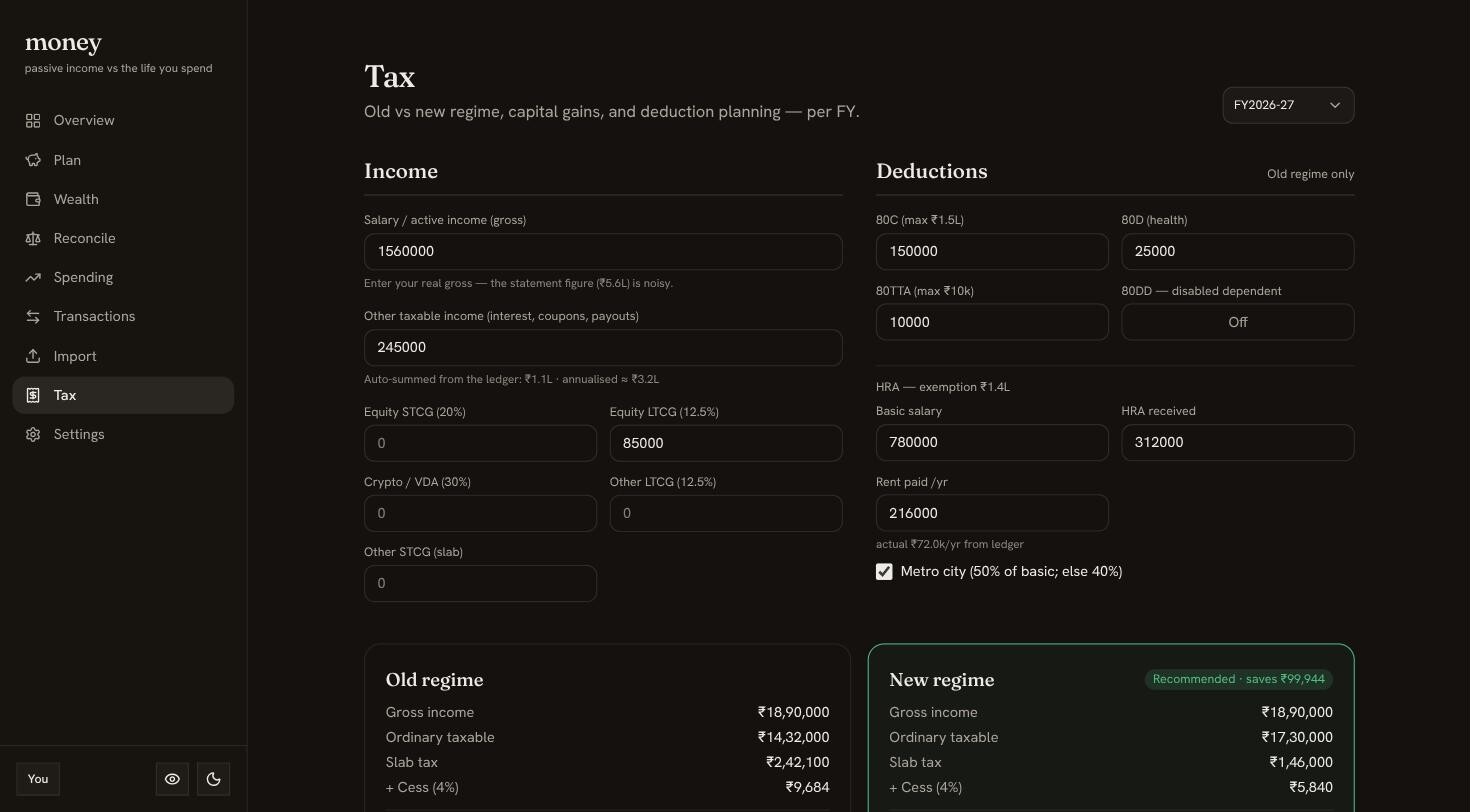
Old regime or new? Stop guessing — see it in rupees.
A side-by-side comparison across both Indian tax regimes, with deduction planning and capital-gains buckets, all built around the April–March financial year. It names the winner and the amount.
- Old vs. new regime, side by side
- Deduction planning and capital-gains buckets
- Built for the Indian FY (1 Apr – 31 Mar)
your data
Your money data is the last thing you should hand to a startup.
So don't. This one is built to be run by you — or by exactly one person you already trust with it.
Run it on your own box
One Docker image, all state in a folder you back up. Self-hosted, your financial data never leaves the machine. The app makes exactly one kind of outbound call — foreign-exchange rates — and none at all if you skip multi-currency.
Walk out anytime
Export your ledger, plan, and spending as plain CSV whenever you like. No proprietary format, no export fee, no hostage-taking. It's your data — leaving is a button, not a support ticket.
run it
Two ways to run it.
Same app, same code. Pick who holds the keys.
hosted
money.reuk.dev
I run it, keep it updated, and invite you in. Nothing to maintain, no server to babysit — and you can export your data and walk out whenever you like.
Use the hosted appself-hosted
docker compose up
Your box, your data, your rules. One public image, migrations on boot, and a first-run setup screen. TLS is yours to run; the full walkthrough is a click away.
Read the self-host guide